Top_BLH
How to use this plot
Make sure you have the required datafields (air_pressure_at_sea_level, atmosphere_boundary_layer_thickness)
You can use it as is by appending this code into your mswms_settings.py:
from mslib.mswms.mpl_hsec_styles import HS_BLH_MSLP_Style_01
register_horizontal_layers = [] if not register_horizontal_layers else register_horizontal_layers
register_horizontal_layers.append((HS_BLH_MSLP_Style_01, [next(iter(data))]))
If you want to modify the plot
Download this
filePut this file into your mswms_settings.py directory, e.g. ~/mss
Append this code into your mswms_settings.py:
from Top_BLH import HS_BLH_MSLP_Style_01
register_horizontal_layers = [] if not register_horizontal_layers else register_horizontal_layers
register_horizontal_layers.append((HS_BLH_MSLP_Style_01, [next(iter(data))]))
Plot Code
"""
This file is part of MSS.
:copyright: Copyright 2021-2026 by the MSS team, see AUTHORS.
:license: APACHE-2.0, see LICENSE for details.
Licensed under the Apache License, Version 2.0 (the "License");
you may not use this file except in compliance with the License.
You may obtain a copy of the License at
http://www.apache.org/licenses/LICENSE-2.0
Unless required by applicable law or agreed to in writing, software
distributed under the License is distributed on an "AS IS" BASIS,
WITHOUT WARRANTIES OR CONDITIONS OF ANY KIND, either express or implied.
See the License for the specific language governing permissions and
limitations under the License.
"""
import logging
import warnings
import numpy as np
import matplotlib.pyplot as plt
import mpl_toolkits.axes_grid1.inset_locator
import matplotlib.colors
import mpl_toolkits.basemap
from matplotlib import patheffects
from mslib.mswms.mpl_hsec import MPLBasemapHorizontalSectionStyle
from mslib.mswms.utils import make_cbar_labels_readable
import mslib.mswms.generics as generics
from mslib.utils import thermolib
from mslib.utils.units import convert_to
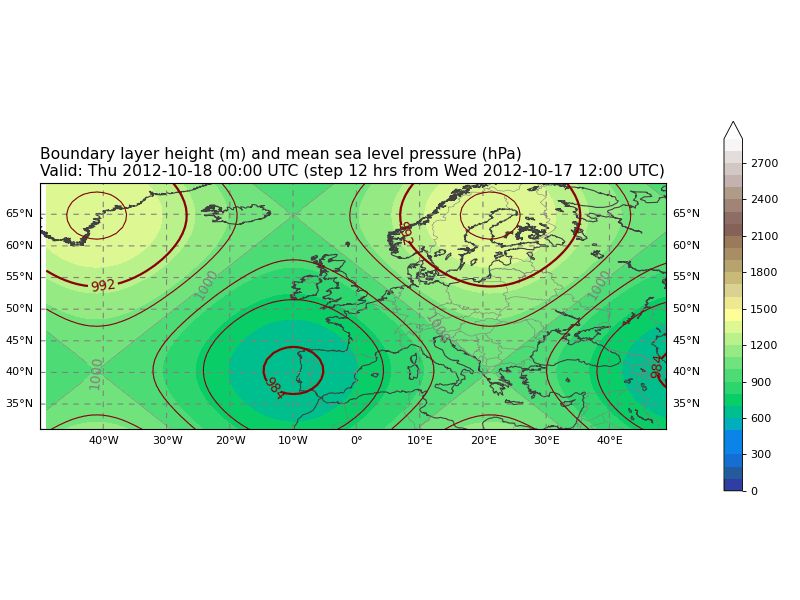
class HS_BLH_MSLP_Style_01(MPLBasemapHorizontalSectionStyle):
"""
Surface Field: Boundary Layer Height
"""
name = "BLH"
title = "Boundary Layer Height (m)"
# Variables with the highest number of dimensions first (otherwise
# MFDatasetCommonDims will throw an exception)!
required_datafields = [
("sfc", "air_pressure_at_sea_level", "hPa"),
("sfc", "atmosphere_boundary_layer_thickness", "m")]
def _plot_style(self):
bm = self.bm
ax = self.bm.ax
data = self.data
thick_contours = np.arange(952, 1050, 8)
thin_contours = [c for c in np.arange(952, 1050, 2)
if c not in thick_contours]
mslp = data["air_pressure_at_sea_level"]
# Colors in python2.6/site-packages/matplotlib/colors.py
cs = bm.contour(self.lonmesh, self.latmesh, mslp,
thick_contours, colors="darkred", linewidths=2)
ax.clabel(cs, fontsize=12, fmt='%.0f')
cs = bm.contour(self.lonmesh, self.latmesh, mslp,
thin_contours, colors="darkred", linewidths=1)
# Filled contours of BLH, interval 100m.
blh = data["atmosphere_boundary_layer_thickness"]
contours = bm.contourf(
self.lonmesh, self.latmesh, blh, np.arange(0, 3000, 100), cmap=plt.cm.terrain, extend="max")
self.add_colorbar(contours)
# Labelled thin grey contours of BLH, interval 500m.
cs = bm.contour(self.lonmesh, self.latmesh, blh,
np.arange(0, 3000, 500), colors="grey", linewidths=0.5)
ax.clabel(cs, fontsize=12, fmt='%.0f')
# Title
titlestring = "Boundary layer height (m) and mean sea level pressure (hPa)"
titlestring += f'\nValid: {self.valid_time.strftime("%a %Y-%m-%d %H:%M UTC")}'
if self.uses_inittime_dimension():
time_step = self.valid_time - self.init_time
time_step_hrs = (time_step.days * 86400 + time_step.seconds) // 3600
titlestring += f' (step {time_step_hrs:d} hrs from {self.init_time.strftime("%a %Y-%m-%d %H:%M UTC")})'
if not self.noframe:
ax.set_title(titlestring,
horizontalalignment='left', x=0, fontsize=14)
else:
ax.text(bm.llcrnrx, bm.llcrnry, titlestring,
fontsize=10, bbox=dict(facecolor='white', alpha=0.6))