Plot Gallery
To see how to build your own plot, look at these examples for Top-View, Side-View or Linear-View
".
".
"
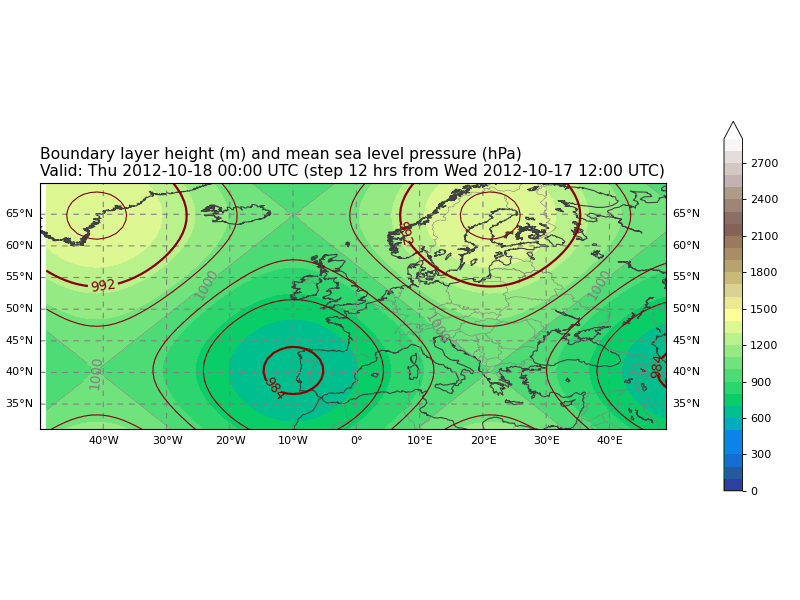
BLHBoundary Layer Height (m)
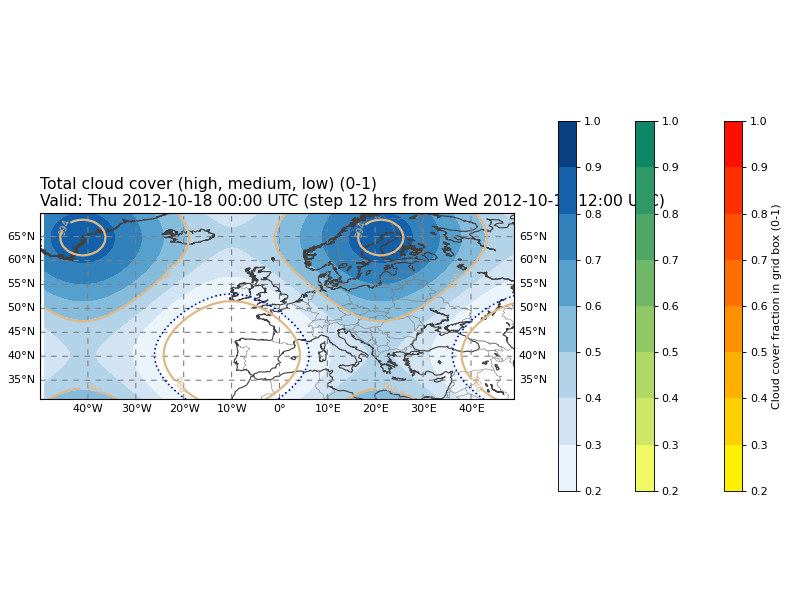
TCCCloud Cover (0-1)
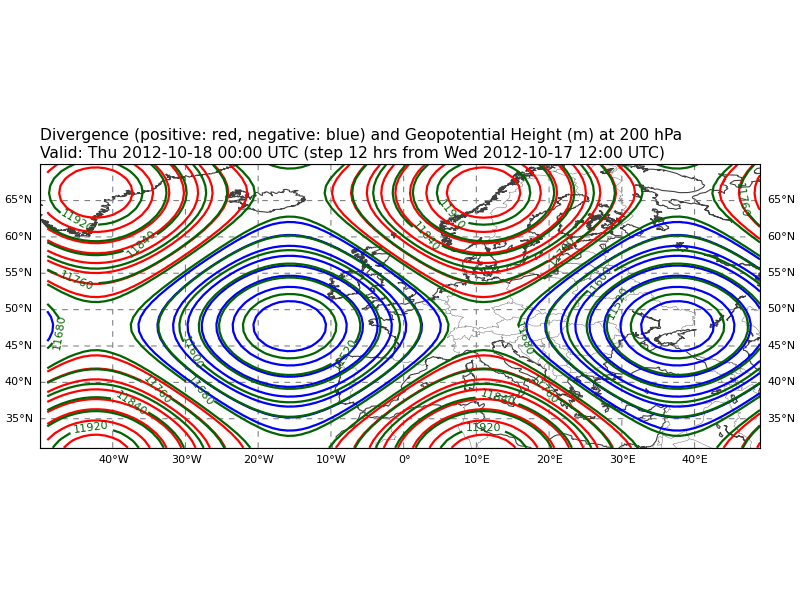
PLDiv01Divergence and Geopotential Height (m)
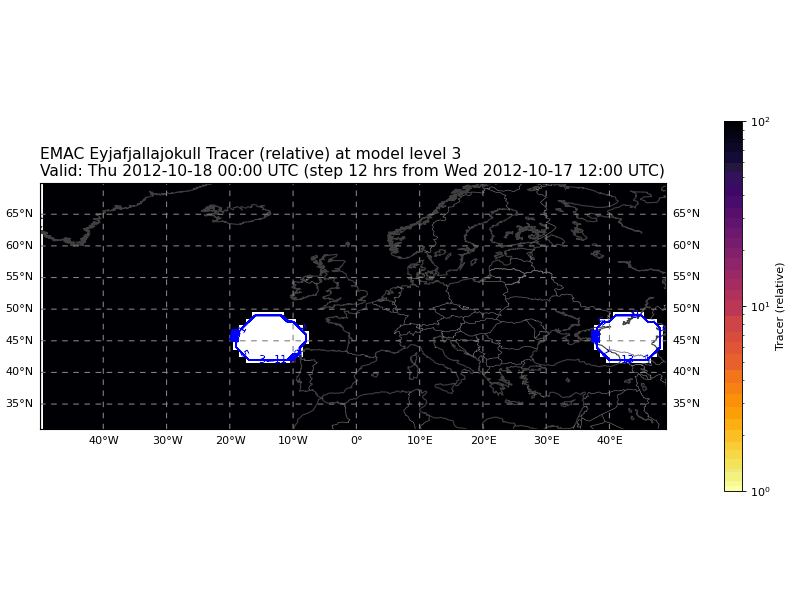
EMAC_Eyja_TracerEMAC Eyjafjallajokull Tracer (Model Level) (relative)
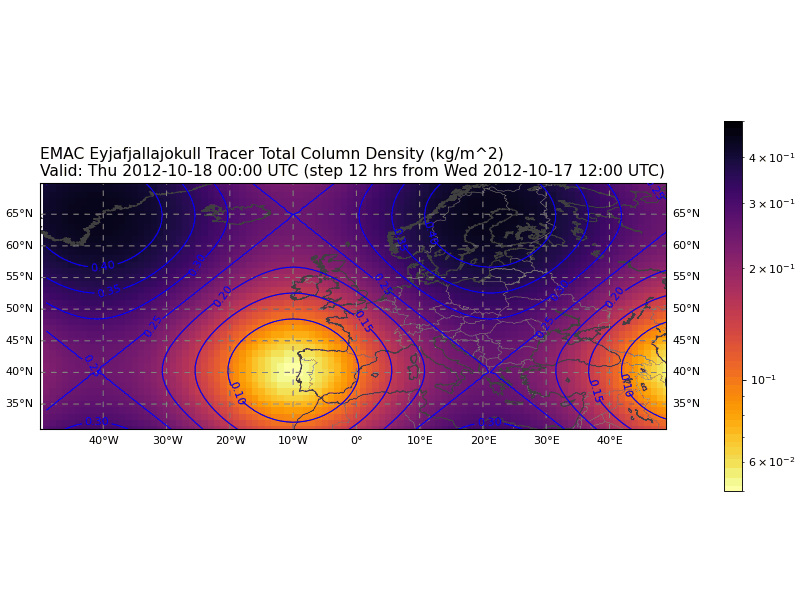
EMAC_Eyja_TotalColumnEMAC Eyjafjallajokull Tracer Total Column Density (kg/m^2)
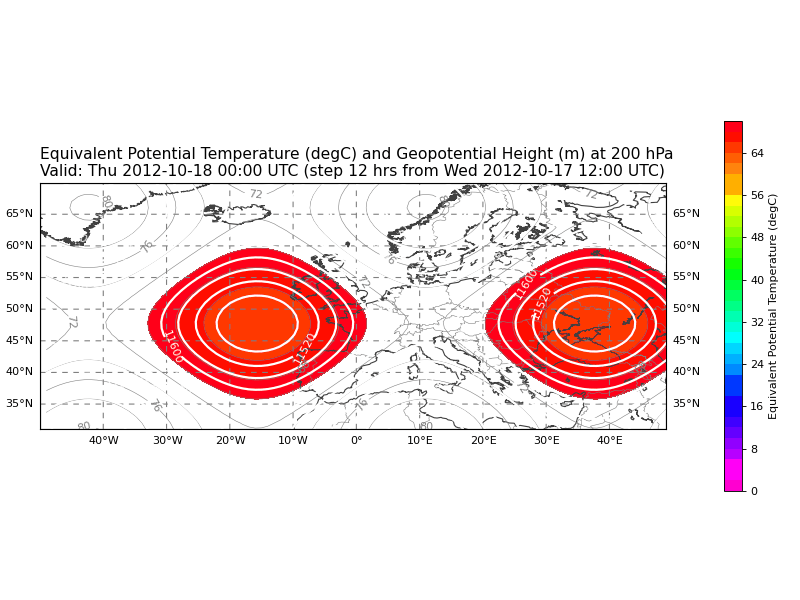
PLEQPT01Equivalent Potential Temperature (degC) and Geopotential Height (m)
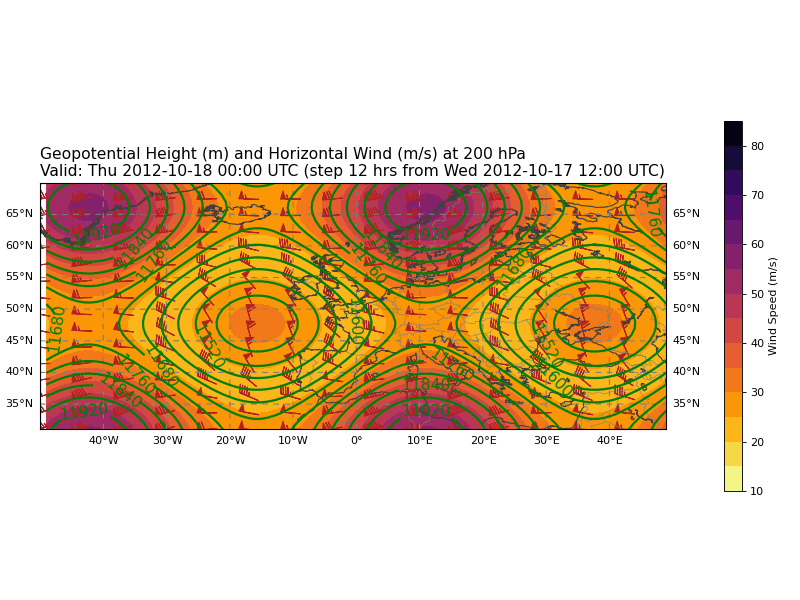
PLGeopWindGeopotential Height (m) and Horizontal Wind (m/s)
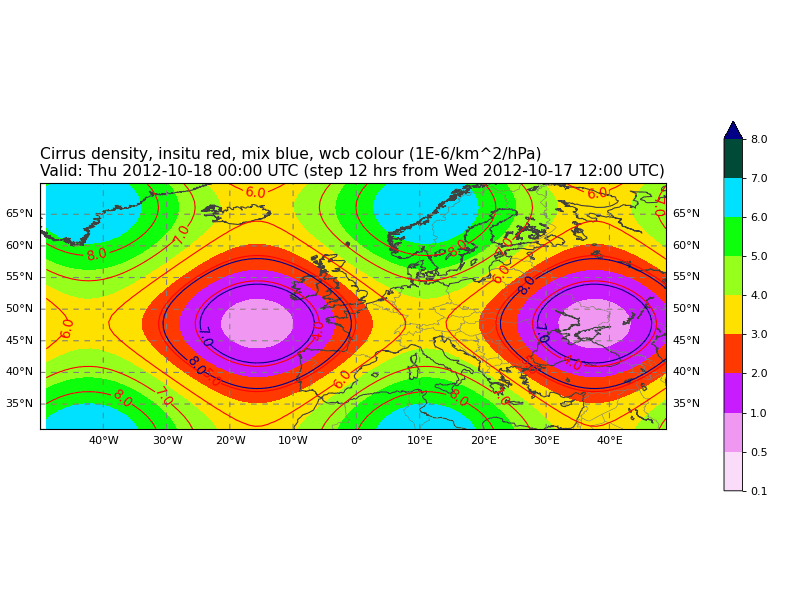
PLLagrantoTrajCirrus density, insitu red, mix blue, wcb colour (1E-6/km^2/hPa)
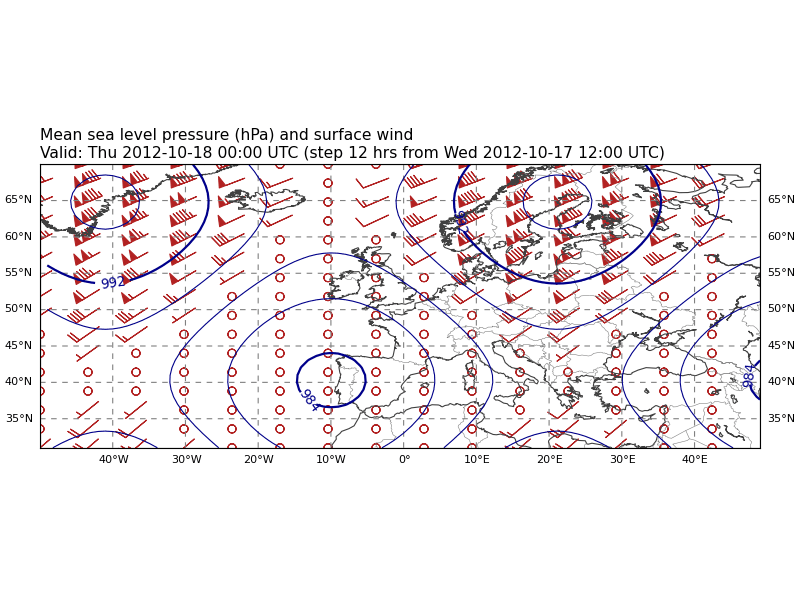
MSLPMean Sea Level Pressure (hPa)
MSG_BT108Brightness Temperature 10.8um (K)
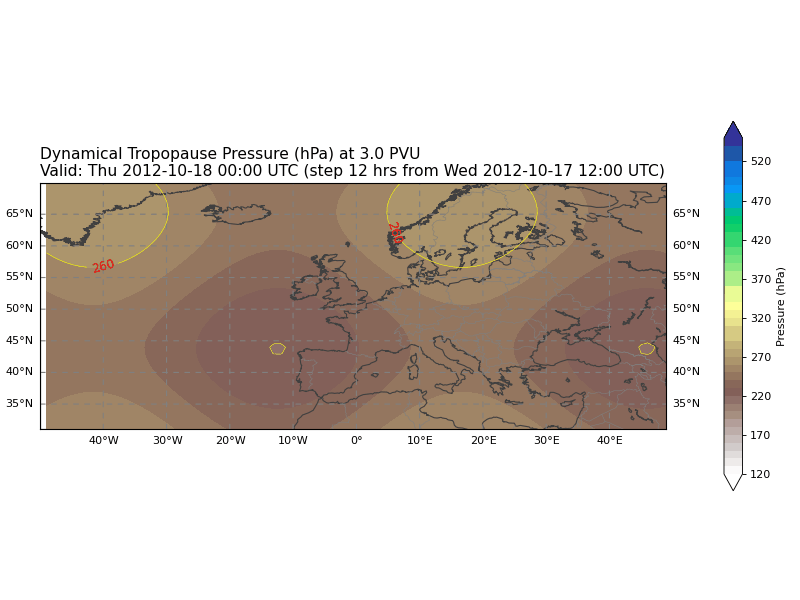
PVTropo01Dynamical Tropopause
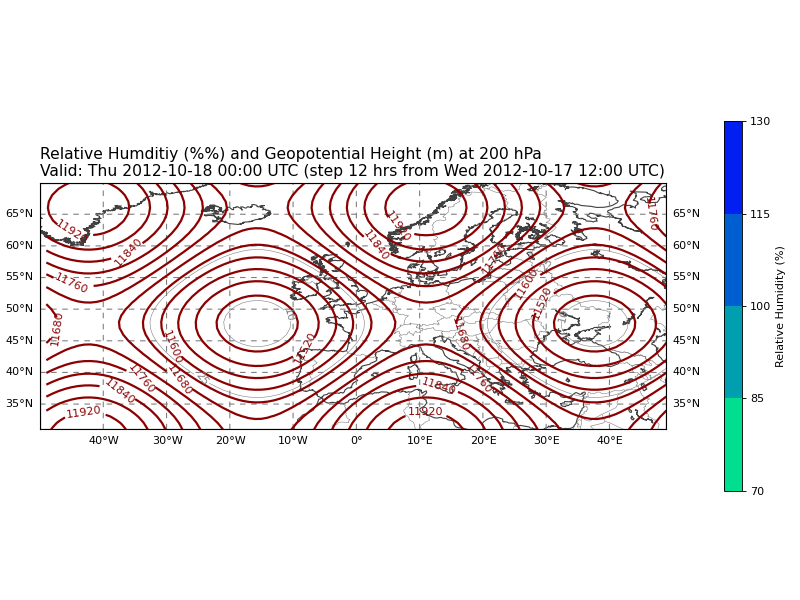
PLRelHum01Relative Humditiy (%) and Geopotential Height (m)
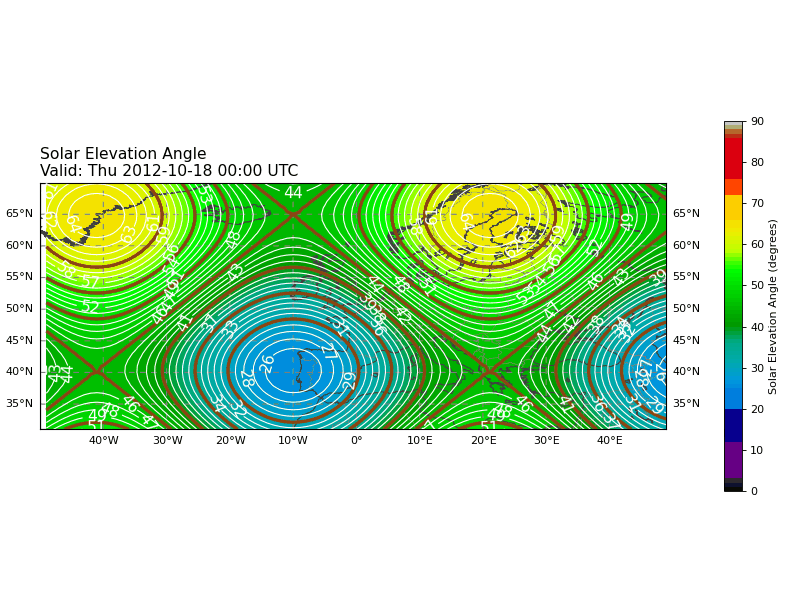
SEASolar Elevation Angle (degrees)
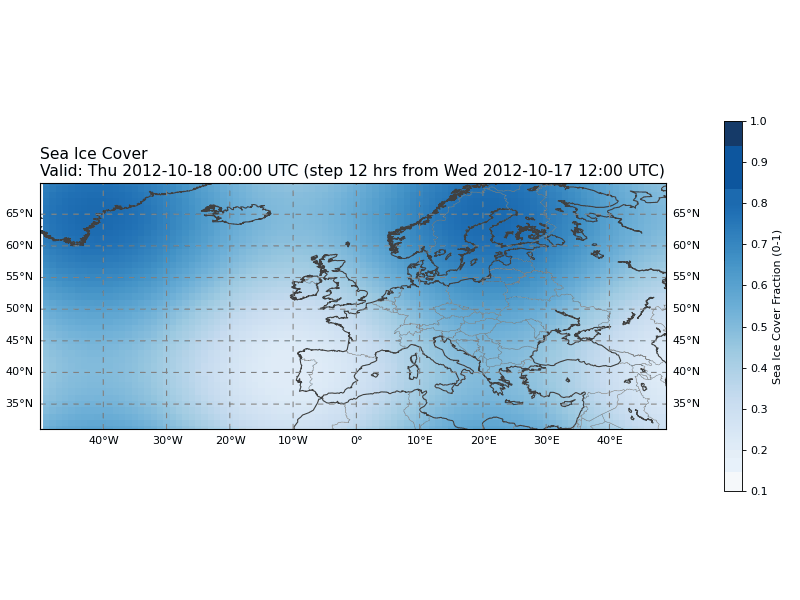
CISea Ice Cover Fraction (0-1)
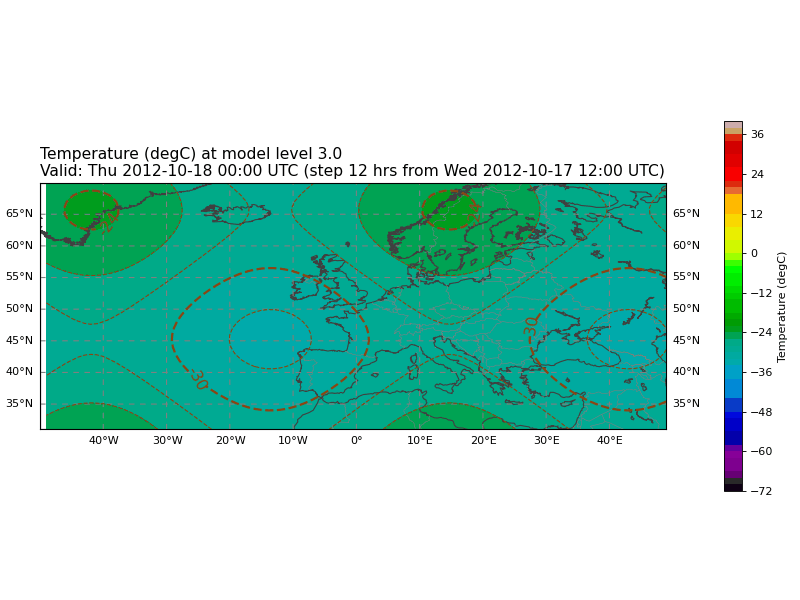
MLTemp01Temperature (Model Level) (degC)
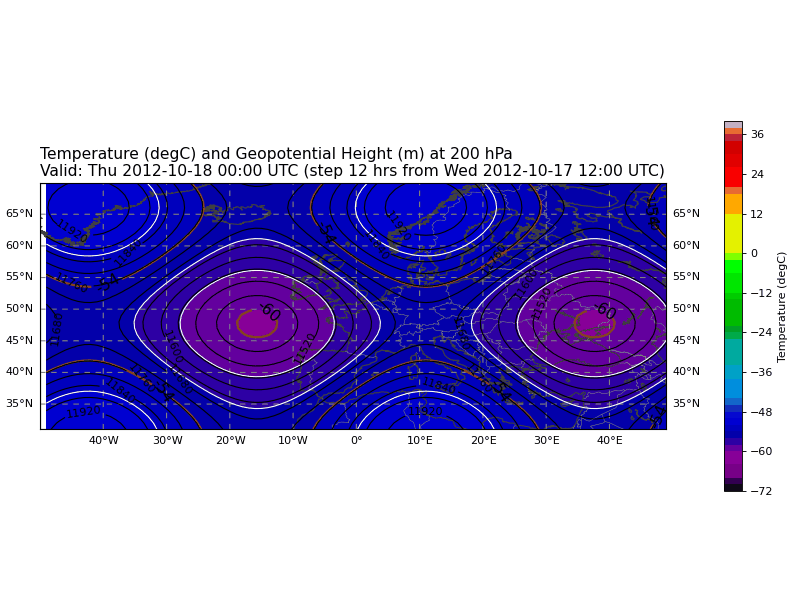
PLTemp01Temperature (degC) and Geopotential Height (m)
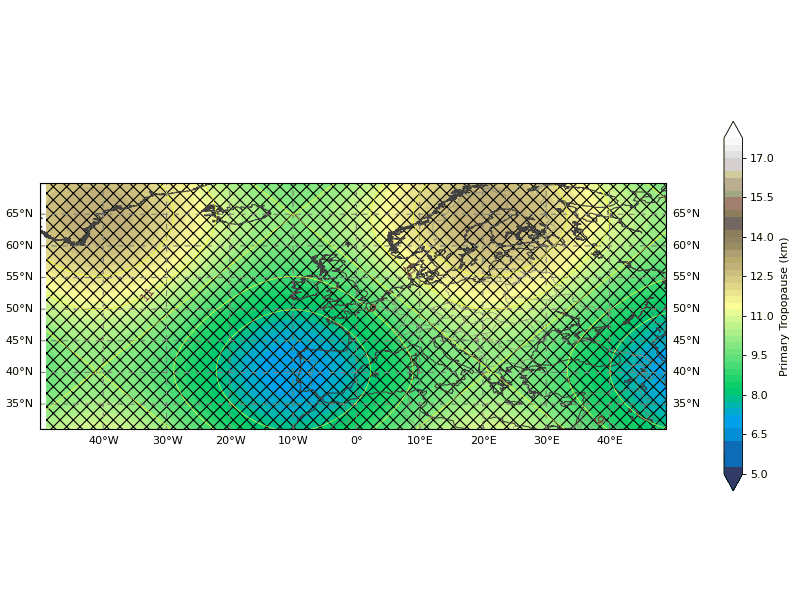
ThermalTropo01Thermal Tropopause
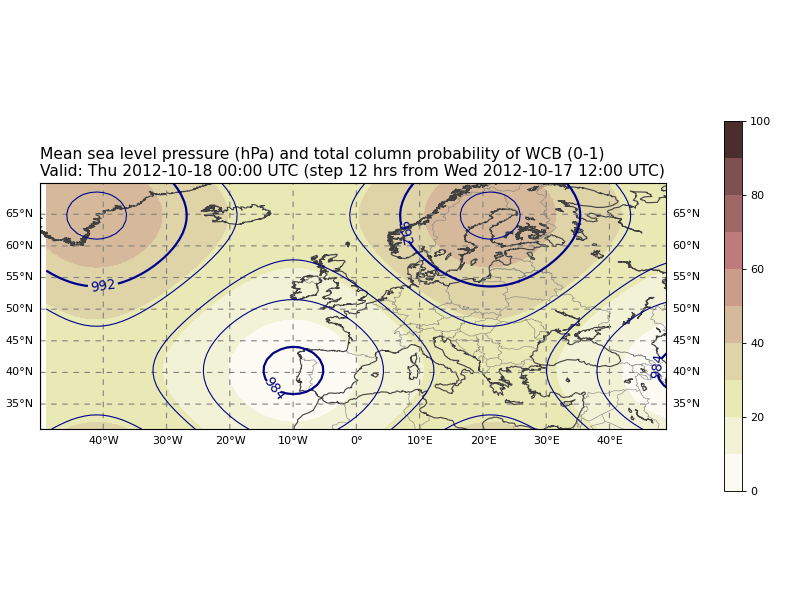
VIProbWCBTotal Column Probability of WCB (%)
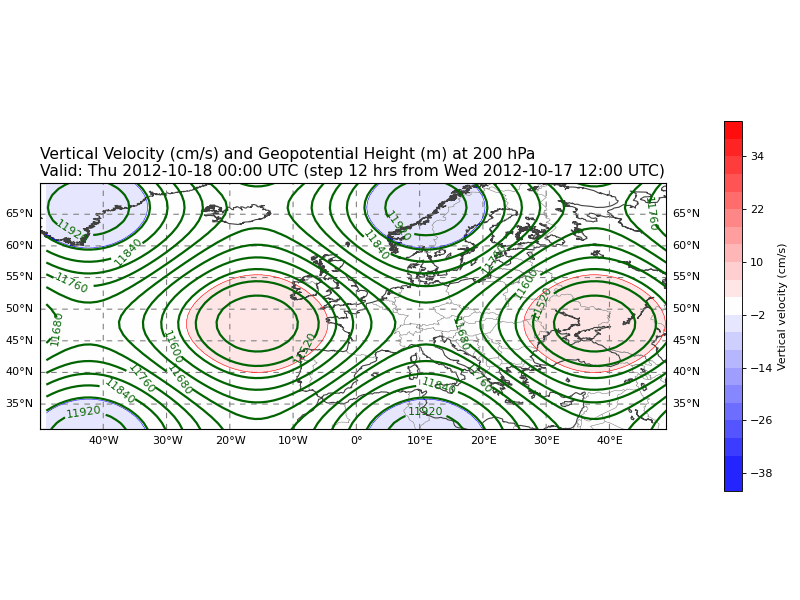
PLW01Vertical Velocity (cm/s) and Geopotential Height (m)